« Amazon ranking | Main | health co-ops from a civic perspective »
August 17, 2009
the role of government (the big picture)
The size and scope of government is one of our most basic debates, and underlying it, I think, is a debate about the past. Conservatives think the government began very small and has grown inexorably, diminishing freedom. They argue that expanding the government's role in health care would mark another step on the long road to serfdom. Supposedly, George W. Bush lost his way by enlarging the government, and that is why Republicans were beaten in 2008. For their part, liberals think that our age has been marked by deregulation, spending cuts, neoliberalism, and corporate-led globalization. They see the Democratic health reform proposals as very modest countermeasures.
The truth seems more complicated than either perspective, although I'd give liberals the edge overall. One measure of the size of government is the amount of revenue it collects, almost all in the form of mandatory taxes. As the following graph shows, federal taxation as a percentage of GDP doubled in the Great Depression and more than doubled again during World War II. It has been fairly stable since then. It was just half a percentage point lower when Ronald Reagan left office than when he was sworn in. The biggest decline was during the George W. Bush years, although we borrowed to make up for the lost revenue, so we will have to pay that back later. (It's very hard to believe that Bush would have been more popular if he had cut government spending and reduced the deficit, as conservatives are now arguing.)
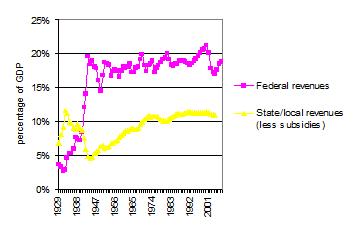
Meanwhile, state revenues (the yellow line, above) have risen steadily. Below is the other side of that coin: the trend in per capita inflation-adjusted spending by states and localities:
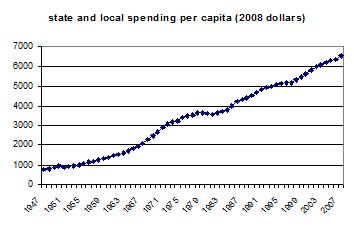
I think both sides in the debate may be a little surprised to find that the clearest trend is a steady increase in the size of government during the age of neoliberalism--but at the state and local level, not in Washington.
The government also regulates, and that's a harder matter to capture in a graph. But consider that in the 1970s, the federal government regulated financial markets, school assignments (because federal judges imposed desegregation plans), and the physical planning of major cities. It has stepped back in all those areas, although it has added some environmental and safety regulations.
Summing up, I'd certainly dispute the "Road the Serfdom" thesis. The national government is probably somewhat less intrusive in 2009 than it was in 1949. On the other hand, the left should recognize that even in an age of "neoliberalism," federal taxation has remained steady, and states are spending more every year.
Leaving aside cheap and hyperbolic rhetoric, both sides in Congress agree about roughly 80% of the federal budget (the existing entitlements, debt service, and the broad outlines of military spending), so their differences are subtle. They are not arguing about the fundamental nature of the republic but about the kinds of variation we see in the first graph during the decades since 1945. For example, the projected cost of the health care plan (at most, $1 trillion over ten years) is well below 1% of GDP (which is $13.8 trillion per year now, and rising). So the health care plan would cause a hard-to-discern upward wriggle in the first graph above.
Data for the first graph provided under a Creative Commons License by Daniel Schmelzer. Federal revenues for 2005-2007 added from CBO, Budget and Economic Outlook, 2008, table f-5. Second graph is my analysis from the Statistical Almanac of the United States.
August 17, 2009 8:50 AM | category: none